How Data-Driven DMV Modernization Reduced Customer Wait Times
November 6, 2026
November 6, 2026
A large U.S. state motor vehicle agency serves customers across a high-volume network of driver license offices while also supporting an expanding range of digital services. Managing that environment requires balancing walk-in demand, appointments, staffing, customer preparation, and changing service needs while maintaining a consistent experience across locations.
As part of a broader modernization effort, the agency used Q-Flow wait-time data alongside transaction and attendance information to better understand customer flow and support operational decision-making. Over time, the agency combined this data-driven approach with expanded digital services, customer preparation tools, and workflow improvements designed to reduce unnecessary office visits and make in-person transactions more efficient.
The results were significant. Average customer wait times for a typical visit fell from approximately 2 hours and 52 minutes in April 2025 to 22 minutes in July 2026, an 87% reduction that saved customers approximately 2.5 hours per visit.
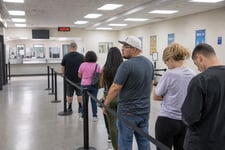
High-volume driver license offices must serve customers with a wide range of needs while managing fluctuating demand throughout the day and across locations. When more customers require in-person service than an office can efficiently accommodate, longer waits can affect both the customer experience and staff workloads.
Repeat visits can add additional pressure. Customers who arrive without the necessary documentation may be unable to complete their transaction, requiring another trip and creating additional demand within the service network.
At the same time, operational leaders need reliable information about customer volume, service times, appointment availability, staffing, and transaction activity to understand where improvements are needed.
The agency’s modernization efforts focused on addressing these connected challenges by reducing wait times, improving customer preparedness, expanding access to online services, increasing appointment availability, and using operational data to make more informed decisions.
Q-Flow wait-time data became one part of a broader operational data environment used to monitor customer flow and evaluate service performance.
Rather than focusing only on how long customers waited, the agency looked at the wider factors influencing the service experience. This included how customers accessed services, whether they arrived prepared, how appointments were being used, how long individual transactions took, and how staffing aligned with demand.
The broader modernization program also expanded the types of transactions available online and introduced tools designed to help customers prepare before and during their visit. Together, these initiatives helped reduce avoidable demand at physical offices while supporting more efficient service for customers who still required in-person assistance.
The clearest measure of improvement was the reduction in customer waiting.
Average wait time for a typical visit decreased by 87%, falling from approximately 2 hours and 52 minutes in April 2025 to 22 minutes in July 2026.
Other measures demonstrated progress across the broader service operation:
Together, these results show improvements extending beyond wait-time reduction alone. Customers gained more ways to complete transactions, additional opportunities to schedule appointments, and better tools for arriving prepared, while staff benefited from more efficient workflows and operational information.

The agency’s transformation demonstrates how improving the DMV experience depends on addressing the full service journey rather than focusing on a single interaction.
Reducing customer wait times was a major outcome, but the broader improvements also helped customers determine whether they needed to visit an office, prepare more effectively when an in-person transaction was necessary, and access additional appointment and online service options.
For staff and operational leaders, the combination of Q-Flow wait-time data and broader performance information provided greater insight into how demand, staffing, service times, and customer behavior affected daily operations.
By combining data-driven decision-making with digital access, customer preparation, increased appointment capacity, and workflow improvements, the agency created a more efficient and predictable service environment for both customers and staff.
Is your organization looking to improve wait times and customer experience with intelligent queue management?